

Unveiling the Mystery: Super Theoretical Capacity in Lithium-Ion Batteries
By hoppt
Why lithium battery exists super theoretical capacity phenomenon
In lithium-ion batteries (LIBs), many transition metal oxide-based electrodes exhibit unusually high storage capacity beyond their theoretical value. Although this phenomenon has been widely reported, the underlying physicochemical mechanisms in these materials remain elusive and remain a matter of debate.
Profile of results
Recently, Professor Miao Guoxing from the University of Waterloo, Canada, Professor Yu Guihua from the University of Texas at Austin, and Li Hongsen and Li Qiang from Qingdao University jointly published a research paper on Nature Materials under the title of "Extra storage capacity in transition metal oxide lithium-ion batteries revealed by in situ magnetometry". In this work, the authors used in situ magnetic monitoring to demonstrate the presence of strong surface capacitance on metal nanoparticles and that a large number of spin-polarized electrons can be stored in already reduced metal nanoparticles, which is consistent with the spatial charge mechanism. In addition, the revealed spatial charge mechanism can be extended to other transition metal compounds, providing a key guide for the establishment of advanced energy storage systems.
Research highlights
(1) A typical Fe was studied by using the in-situ magnetic monitoring technique3O4/ Evolution of the electronic structure inside the Li battery;
(2) reveals that the Fe3O4In the / Li system, the surface charge capacity is the main source of the extra capacity;
(3) The surface capacitance mechanism of metal nanoparticles can be extended to a wide range of transition metal compounds.
Text and text guide
- Structural characterization and electrochemical properties
Monodisperse hollow Fe was synthesized by conventional hydrothermal methods3O4Nanospheres, and then performed at 100 mAg−1Charge and discharge at current density (Figure 1a), the first discharge capacity is 1718 mAh g−1, 1370 mAhg in the second and third time, respectively−1And 1,364 mAhg−1, Far over 926 mAhg−1The theory of expectations. BF-STEM images of the fully discharged product (Figure 1b-c) indicate that after lithium reduction, Fe3O4The nanospheres were converted into smaller Fe nanoparticles measuring about 1 – 3 nm, dispersed in Li2O centre.
To demonstrate the change in magnetism during the electrochemical cycle, a magnetization curve after full discharge to 0.01 V was obtained (Figure 1d), showing the superparamagnetic behavior due to the formation of nanoparticles.
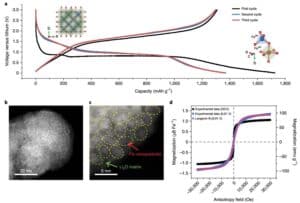
Figure 1 (a) at 100 mAg−1Fe of the cycling at the current density3O4/ Constant current charge and discharge curve of Li battery; (b) fully lithium Fe3O4The BF-STEM image of the electrode; (c) the presence of Li in the aggregate2High-resolution BF-STEM images of both O and Fe; (d) Fe3O4The hysteresis curves of the electrode before (black) and after (blue), and the Langevin fitted curve of the latter (purple).
- Real-time detection of structural and magnetic evolution
In order to combine the electrochemistry with Fe3O4Of structural and magnetic changes linked to the Fe3O4The Electrodes were subjected to in situ X-ray diffraction (XRD) and in situ magnetic monitoring. Fe in a series of XRD diffraction patterns during the initial discharge from the open-circuit voltage (OCV) to 1.2V3O4The diffraction peaks did not change significantly in either intensity or position (Figure 2a), indicating that the Fe3O4Only experienced the Li intercalation process. When charged to the 3V, the Fe3O4The anti-spinel structure remains intact, suggesting that the process in this voltage window is highly reversible. Further in-situ magnetic monitoring combined with constant current charge-discharge tests was performed to investigate how magnetization evolves in real time (Figure 2b).
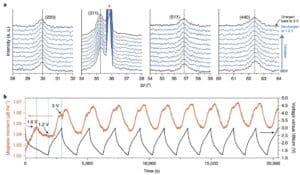
Figure 2 Characterization of in-situ XRD and magnetic monitoring.(A) in situ XRD; (b) Fe3O4Electrochemical charge-discharge curve under 3 T applied magnetic field and corresponding reversible in situ magnetic response.
To gain a more basic understanding of this conversion process in terms of magnetization changes, the magnetic response is collected in real time and the corresponding phase transition accompanying electrochemically driven reactions (Figure 3). It is quite clear that during the first discharge, the Fe3O4The magnetization response of the electrodes differs from the other cycles due to Fe during the first lithalization3O4Due to the irreversible phase transition occurs. When the potential dropped to 0.78V, the Fe3O4The antispinel phase was converted to contain Li2The class FeO halite structure of O, Fe3O4The phase cannot be restored after charging. Correspondingly, the magnetization drops rapidly to 0.482 μ b Fe−1. As lithialization proceeds, no new phase formed, and the intensity of (200) and (220) class FeO diffraction peaks began to weaken.equal Fe3O4There is no significant XRD peak retained when the electrode is completely liialized (Figure 3a). Note that when the Fe3O4 electrode discharges from 0.78V to 0.45V, the magnetization (from 0.482 μ b Fe−1Increased to 1.266 μ bFe−1), This was attributed to the conversion reaction from FeO to Fe. Then, at the end of the discharge, the magnetization was slowly decreased to 1.132 μ B Fe−1. This finding suggests that the fully reduced metal Fe0Nanoparticles may still participate in the lithium storage reaction, thus reducing the magnetization of the electrodes.
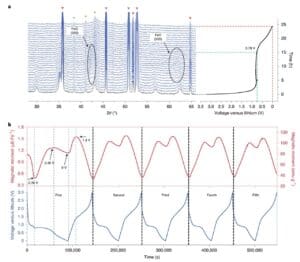
Figure 3 In situ observations of the phase transition and the magnetic response.(a)Fe3O4In situ XRD map collected during the first discharge of the electrode; (b) Fe3O4In situ magnetic force measurement of electrochemical cycles of / Li cells at an applied magnetic field of 3 T.
- Fe0/Li2Surface capacitance of the O system
Fe3O4The magnetic changes of the electrodes occur at low voltages, at which an additional electrochemical capacity is most likely generated, suggesting the presence of undiscovered charge carriers within the cell. To explore the potential lithium storage mechanism, Fe was studied by means of XPS, STEM and magnetic performance spectrum3O4Electrodes of magnetization peaks at 0.01V,0.45V and 1.4V to determine the source of the magnetic change. The results show that the magnetic moment is a key factor affecting the magnetic change, because the measured Fe0/Li2The Ms of the O system are not affected by the magnetic anisotropy and the interparticle coupling.
To further understand the Fe3O4The kinetic properties of the electrodes at low voltage, cyclic voltammetry at different scan rates. As shown in Figure 4a, the rectangular cyclic voltammogram curve appears within the voltage range between 0.01V and 1V (Figure 4a). Figure 4b shows that the Fe3O4A capacitive response occurred on the electrode. With the highly reversible magnetic response of the constant current charge and discharge process (Figure 4c), the magnetization of the electrode decreased from 1V to 0.01V during the discharge process, and increased again during the charging process, indicating that Fe0Of the capacitor-like surface reaction is highly reversible.
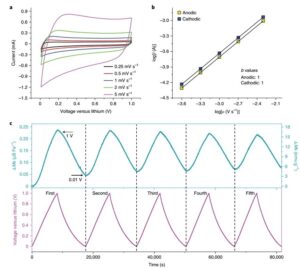
Figure 4 electrochemical properties and in situ magnetic characterization at 0.011 V.(A) The cyclic voltammetric curve.(B) the b value is determined using the correlation between the peak current and the scan rate; (c) the reversible change of the magnetization relative to the charge-discharge curve under a 5 T applied magnetic field.
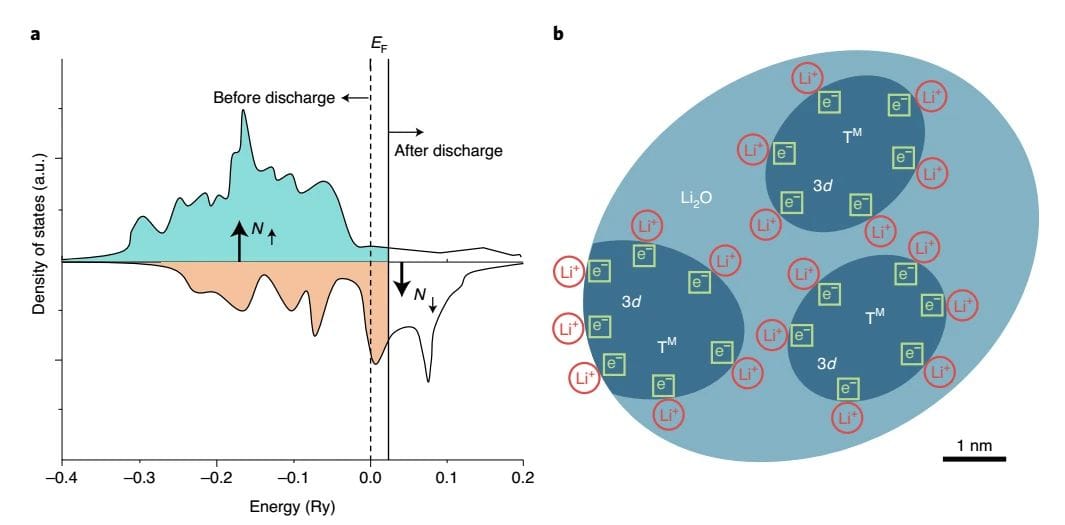
above-mentioned Fe3O4The electrochemical, structural and magnetic features of the electrodes indicate that the additional battery capacity is determined by Fe0The spin-polarized surface capacitance of the nanoparticles is caused by the accompanying magnetic changes. The spin-polarized capacitance is the result of spin-polarized charge accumulation at the interface and can display a magnetic response during charge and discharge.to Fe3O4The base electrode, during the first discharge process, was dispersed in Li2Fine Fe nanoparticles in the O substrate have large surface-to-volume ratios and realize a high density of states at the Fermi level due to the highly localized d orbitals. According to Maier's theoretical model of spatial charge storage, the authors propose that large amounts of electrons can be stored in the spin-splitting bands of metallic Fe nanoparticles, which may be found in Fe / Li2Creating spin-polarized surface capacitors in the O nanocomposites (Figure 5).

graph 5Fe/Li2A Schematic representation of the surface capacitance of the spin-polarized electrons at the O-interface.(A) the schematic diagram of the spin polarization state density of the surface of ferromagnetic metal particles (before and after discharge), contrary to the bulk spin polarization of iron; (b) the formation of the space charge region in the surface capacitor model of overstored lithium.
Summary and Outlook
TM / Li was investigated by advanced in-situ magnetic monitoring2The evolution of the internal electronic structure of the O nanocomposite to reveal the source of additional storage capacity for this lithium-ion battery. The results show that, both in the Fe3O4/ Li model cell system, electrochemically reduced Fe nanoparticles can store large amounts of spin-polarized electrons, resulting due to excessive cell capacity and significantly altered interfacial magnetism. Experiments further validated CoO, NiO, and FeF2And Fe2The presence of such capacitance in N electrode material indicates the existence of spin-polarized surface capacitance of metal nanoparticles in lithium ion batteries and lays the foundation for the application of this spatial charge storage mechanism in other transition metal compound-based electrode materials.
Literature link
Extra storage capacity in transition metal oxide lithium-ion batteries revealed by in situ magnetometry (Nature Materials , 2020, DOI: 10.1038/s41563-020-0756-y)
The influence of lithium electrode wafer design formula and electrode wafer defects on performance
- Pole film design foundation article
The lithium battery electrode is a coating composed of particles, evenly applied to the metal fluid. Lithium ion battery electrode coating can be regarded as a composite material, mainly composed of three parts:
(1) Active substance particles;
(2) the constituent phase of the conductive agent and the agent (carbon adhesive phase);
(3) Pore, fill with the electrolyte.
The volume relationship of each phase is expressed as:
Porosity + living matter volume fraction + carbon adhesive phase volume fraction =1
The design of lithium battery electrode design is very important, and now the basic knowledge of lithium battery electrode design is briefly introduced.
(1) Theoretical capacity of the electrode material The theoretical capacity of the electrode material, that is, the capacity provided by all the lithium ions in the material involved in the electrochemical reaction, its value is calculated by the following equation:
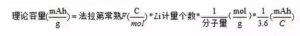
For example, the LiFePO4The molar mass is 157.756 g/mol, and its theoretical capacity is:

This calculated value is only the theoretical gram capacity. In order to ensure the reversible structure of the material, the actual lithium ion removal coefficient is less than 1, and the actual gram capacity of the material is:
Actual gram capacity of material = theoretical capacity of lithium ion unplugging coefficient
(2) Battery design capacity and extremely one-sided density Battery design capacity can be calculated by the following formula: battery design capacity = coating surface density active material ratio active material gram capacity pole sheet coating area
Among them, the surface density of the coating is a key design parameter. When the compaction density is unchanged, the increase of the coating surface density means that the pole sheet thickness increases, the electron transmission distance increases, and the electron resistance increases, but the increase degree is limited. In the thick electrode sheet, the increase of the migration impedance of lithium ions in the electrolyte is the main reason affecting the ratio characteristics. Considering the porosity and pore twists, the migration distance of ions in the pore is many times more than the thickness of the pole sheet.
(3) The ratio of negative-positive capacity ratio N / P negative capacity to positive capacity is defined as:
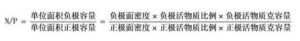
N / P should be greater than 1.0, generally 1.04~1.20, which is mainly in the safety design, to prevent the negative side lithium ion from precipitation without acceptance source, design to consider the process capacity, such as coating deviation. However, when N / P is too large, the battery will lose irreversible capacity, resulting in low battery capacity and lower battery energy density.
For the lithium titanate anode, the positive electrode excess design is adopted, and the battery capacity is determined by the capacity of the lithium titanate anode. The positive excess design is conducive to improving the high temperature performance of the battery: the high temperature gas mainly comes from the negative electrode. In the positive excess design, the negative potential is low, and it is easier to form SEI film on the surface of lithium titanate.
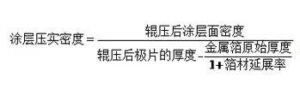
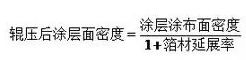
(4) Compaction density and porosity of the coating In the production process, the coating compaction density of the battery electrode is calculated by the following formula. Considering that when the pole sheet is rolled, the metal foil is extended, the surface density of the coating after the roller is calculated by the following formula.
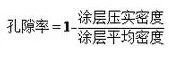
As mentioned earlier, the coating consists of living material phase, carbon adhesive phase and pore, and the porosity can be calculated by the following equation.
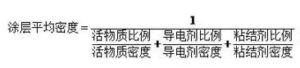
Among them, the average density of coating is: lithium battery electrode is a kind of powder particles of coating, because the powder particle surface rough, irregular shape, when accumulation, particles between particles and particles, and some particles itself have cracks and pores, so powder volume including powder volume, the pores between the powder particles and the particles, therefore, the corresponding variety of electrode coating density and porosity representation. The density of the powder particles refers to the mass of the powder per unit volume. According to the volume of the powder, it is divided into three kinds: true density, particle density and accumulation density. The various densities are defined as follows:
- True density refers to the density obtained by dividing the powder mass by the volume (real volume) excluding the internal and outer gaps of the particles. That is, the density of the matter itself obtained after excluding the volume of all the voids.
- Particle density refers to the density of particles obtained by dividing the powder mass divided by the particle volume including the open hole and the closed hole. That is, the gap between the particles, but not the fine pores inside the particles, the density of the particles themselves.
- Accumulation density, that is, coating density, refers to the density obtained by the powder mass divided by the volume of the coating formed by the powder. The volume used includes the pores of the particles themselves and the voids between the particles.
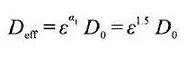
For the same powder, true density> particle density> packing density. The porosity of the powder is the ratio of the pores in the powder particle coating, that is, the ratio of the volume of the void between the powder particles and the pores of the particles to the total volume of the coating, which is commonly expressed as a percentage. The porosity of powder is a comprehensive property related to particle morphology, surface state, particle size and particle size distribution. Its porosity directly affects the infiltration of electrolyte and lithium ion transmission. In general, the larger the porosity, the easier the electrolyte infiltration, and the faster the lithium ion transmission. Therefore, in the design of lithium battery, sometimes to determine the porosity, commonly used mercury pressure method, gas adsorption method, etc. Can also be obtained by using the density calculation. The porosity can also have different implications when using different densities for the calculations. When the density of the porosity of the living substance, the conductive agent and the binder is calculated by the true density, the calculated porosity includes the gap between the particles and the gap inside the particles. When the porosity of the living substance, conductive agent and binder is calculated by the particle density, the calculated porosity includes the gap between the particles, but not the gap inside the particles. Therefore, the pore size of the lithium battery electrode sheet is also multi-scale, generally the gap between the particles is in the micron scale size, while the gap inside the particles is in the nanometer to sub-submicron scale. In porous electrodes, the relationship of transport properties such as effective diffusivity and conductivity can be expressed by the following equation:
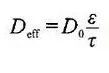
Where D0 represents the intrinsic diffusion (conduction) rate of the material itself, ε is the volume fraction of the corresponding phase, and τ is the circuitous curvature of the corresponding phase. In the macroscopic homogeneous model, the Bruggeman relation is generally used, taking the coefficient ɑ =1.5 to estimate the effective positivity of the porous electrodes.
The electrolyte is filled in the pores of the porous electrodes, in which the lithium ions are conducted through the electrolyte, and the conduction characteristics of the lithium ions are closely related to the porosity. The larger the porosity, the higher the volume fraction of the electrolyte phase, and the greater the effective conductivity of lithium ions. In the positive electrode sheet, electrons are transmitted through the carbon adhesive phase, the volume fraction of the carbon adhesive phase and the detour of the carbon adhesive phase directly determine the effective conductivity of electrons.
The porosity and the volume fraction of the carbon adhesive phase are contradictory, and the large porosity inevitably leads to the volume fraction of the carbon adhesive phase, therefore, the effective conduction properties of lithium ions and electrons are also contradictory, as shown in Figure 2. As the porosity decreases, the lithium ion effective conductivity decreases while the electron effective conductivity increases. How to balance the two is also critical in the electrode design.
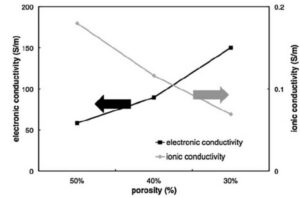
Figure 2 Schematic diagram of porosity and lithium ion and electron conductivity
2. Type and detection of pole defects
At present, in the process of battery pole preparation, more and more online detection technologies are adopted, so as to effectively identify the manufacturing defects of products, eliminate defective products, and timely feedback to the production line, automatic or manual adjustments to the production process, to reduce the defective rate.
The on-line detection technologies commonly used in pole sheet manufacturing include slurry characteristic detection, pole sheet quality detection, dimension detection and so on, For example: (1) the online viscosity meter is directly installed in the coating storage tank to detect the rheological characteristics of the slurry in real time, Test the stability of the slurry; (2) Using X-ray or β -ray in the coating process, Its high measurement accuracy, But large radiation, high price of equipment and maintenance trouble; (3) Laser online thickness measurement technology is applied to measure the thickness of the pole sheet, The measurement accuracy can reach ± 1. 0 μ m, It can also display the change trend of measured thickness and thickness in real time, Facilitate data traceability and analysis; (4) CCD vision technology, That is, the line array CCD is used to scan the measured object, Real-time image processing and analysis of defect categories, Realize the non-destructive online detection of the pole sheet surface defects.
As a tool for quality control, online testing technology is also essential to understand the correlation between defects and battery performance, so as to determine the qualified / unqualified criteria for semi-finished products.
In the latter part, the new method of surface defect detection technology of lithium-ion battery, infrared thermal imaging technology and the relationship between these different defects and electrochemical performance are briefly introduced.consult D. Mohanty A thorough study by Mohanty et al.
(1) Common defects on the pole sheet surface
Figure 3 shows the common defects on the surface of the lithium ion battery electrode, with the optical image on the left and the image captured by the thermal imager on the right.
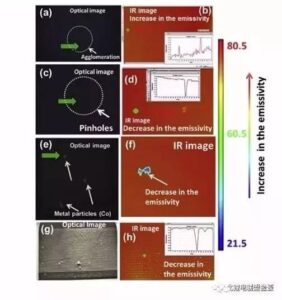
Figure 3 Common defects on the surface of the pole sheet: (a, b) bulge envelope / aggregate; (c, d) drop material / pinhole; (e, f) metal foreign body; (g, h) uneven coating
(A, b) raised bulge / aggregate, such defects can occur if the slurry is evenly stirred or the coating speed is unstable. The gregation of adhesive and carbon black conductive agents leads to low content of active ingredients and light weight of polar tablets.
(c, d) drop / pinhole, these defective areas are not coated and are usually produced by bubbles in the slurry. They reduce the amount of active material and expose the collector to the electrolyte, thus reducing the electrochemical capacity.
(E, f) metal foreign bodies, slurry or metal foreign bodies introduced in the equipment and environment, and metal foreign bodies can cause great harm to lithium batteries. Large metal particles directly impare the diaphragm, resulting in a short circuit between the positive and negative electrodes, which is a physical short circuit. In addition, when the metal foreign body is mixed into the positive electrode, the positive potential increases after charging, the metal solves, spreads through the electrolyte, and then precipitate on the negative surface, and finally puncture the diaphragm, forming a short circuit, which is a chemical dissolution short circuit. The most common metal foreign bodies in the battery factory site are Fe, Cu, Zn, Al, Sn, SUS, etc.
(g, h) uneven coating, such as the slurry mixing is not sufficient, the particle fineness is easy to appear stripes when the particle is large, resulting in uneven coating, which will affect the consistency of the battery capacity, and even appear completely no coating stripe, has an impact on the capacity and safety.
(2) Pole chip surface defect detection technology Infrared (IR) thermal imaging technology is used to detect minor defects on dry electrodes that can damage the performance of lithium-ion batteries. During the online detection, if the electrode defect or pollutant is detected, mark it on the pole sheet, eliminate it in the subsequent process, and feedback it to the production line, and adjust the process in time to eliminate the defects. Infrared ray is a kind of electromagnetic wave that has the same nature as radio waves and visible light. A special electronic device is used to convert the temperature distribution of the surface of an object into a visible image of the human eye, and to display the temperature distribution of the surface of an object in different colors is called infrared thermal imaging technology. This electronic device is called infrared thermal imager. All objects above absolute zero (-273℃) emit infrared radiation.
As shown in Figure 4, the infrared thermal approximator (IR Camera) uses the infrared detector and the optical imaging objective to accept the infrared radiation energy distribution pattern of the measured target object and reflect it on the photosensitive element of the infrared detector to obtain the infrared thermal image, which corresponds to the thermal distribution field on the surface of the object. When there is a defect on the surface of an object, the temperature shifts in the area. Therefore, this technology can also be used to detect the defects on the surface of the object, especially suitable for some defects that cannot be distinguished by optical detection means. When the drying electrode of lithium ion battery is detected online, the electrode electrode is first irradiated by the flash, the surface temperature changes, and then the surface temperature is detected with a thermal imager. The heat distribution image is visualized, and the image is processed and analyzed in real time to detect the surface defects and mark them in time.D. Mohanty The study installed a thermal imager at the outlet of the coater drying oven to detect the temperature distribution image of the electrode sheet surface.
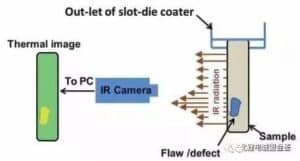
Figure 5 (a) is a temperature distribution map of the coating surface of the NMC positive pole sheet detected by the thermal imager, which contains a very small defect that cannot be distinguished by the naked eye. The temperature distribution curve corresponding to the route segment is shown in the internal inset, with a temperature spike at the defect point. In Figure 5 (b), the temperature increases locally in the corresponding box, corresponding to the defect of the pole sheet surface. FIG. 6 is a surface temperature distribution diagram of the negative electrode sheet showing the existence of defects, where the peak of temperature increases corresponds to the bubble or aggregate, and the area of temperature decreases corresponds to the pinhole or drop.
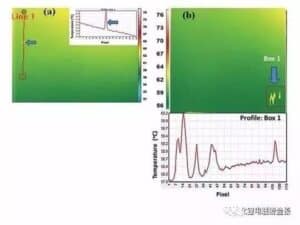
Figure 5 Temperature distribution of the positive electrode sheet surface
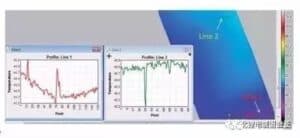
Figure 6 Temperature distribution of negative electrode surface
It can be seen that the thermal imaging detection of temperature distribution is a good means of pole sheet surface defect detection, which can be used for the quality control of pole sheet manufacturing.3. Effect of pole sheet surface defects on battery performance
(1) Impact on battery multiplier capacity and Coulomb efficiency
Figure 7 shows the influence curve of the aggregate and pinhole on the battery multiplier capacity and the coulen efficiency. The aggregate can actually improve the battery capacity, but reduce the coulen efficiency. The pinhole reduces the battery capacity and the Kulun efficiency, and the Kulun efficiency decreases greatly at high rate.
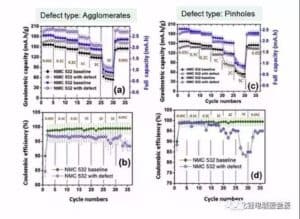
Figure 7 cathode aggregate and pinhole effect on the battery capacity and the efficiency of figure 8 is uneven coating, and metal foreign body Co and Al on the battery capacity and the effect of the efficiency curve, uneven coating reduce battery unit mass capacity 10% -20%, but the whole battery capacity decreased by 60%, this shows that the living mass in the polar piece significantly reduced. Metal Co foreign body reduced capacity and Coulomb efficiency, even in 2C and 5C high magnification, no capacity at all, which may be due to the formation of metal Co in the electrochemical reaction of lithium and lithium embedded, or it may be the metal particles blocked the diaphragm pore caused micro short circuit.
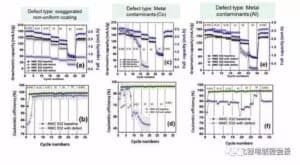
Figure 8 Effects of positive electrode uneven coating and metal foreign bodies Co and Al on battery multiplier capacity and coulen efficiency
Summary of cathode sheet defects: The ates in the cathode sheet coating reduces the Coulomb efficiency of the battery. The pinhole of the positive coating reduces the Coulomb efficiency, resulting in poor multiplier performance, especially at high current density. The heterogeneous coating showed poor magnification performance. Metal particle pollutants may cause micro-short circuits, and therefore may greatly reduce the battery capacity.
Figure 9 shows the impact of the negative leakage foil strip on the multiplier capacity and Kulun efficiency of the battery. When the leakage occurs at the negative electrode, the capacity of the battery is significantly reduced, but the gram capacity is not obvious, and the impact on the Kulun efficiency is not significant.
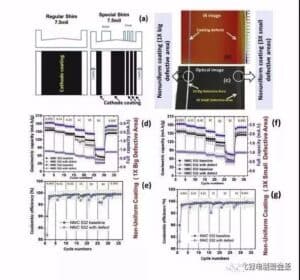
Figure 9 Influence of negative electrode leakage foil strip on battery multiplier capacity and Kulun efficiency (2) Influence on battery multiplier cycle performance Figure 10 is the result of the influence of the electrode surface defect on battery multiplier cycle. The influence results are summarized as follows:
Egregation: at 2C, the capacity maintenance rate of 200 cycles is 70% and the defective battery is 12%, while in 5C cycle, the capacity maintenance rate of 200 cycles is 50% and the defective battery is 14%.
Needlehole: the capacity attenuation is obvious, but no aggregate defect attenuation is fast, and the capacity maintenance rate of 200 cycles 2C and 5C are 47% and 40%, respectively.
Metal foreign body: the capacity of metal Co foreign body is almost 0 after several cycles, and the 5C cycle capacity of metal foreign body Al foil decreases significantly.
Leak strip: For the same leakage area, the battery capacity of multiple smaller stripes decreases faster than a larger stripe (47% for 200 cycles in 5C) (7% for 200 cycles in 5C). This indicates that the larger the number of stripes, the greater the impact on the battery cycle.
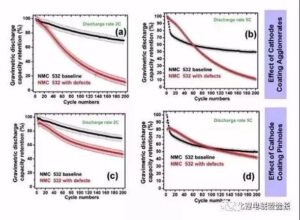
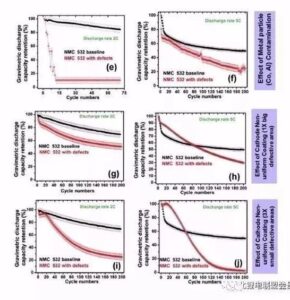
Figure 10 Effect of electrode sheet surface defects on cell rate cycle
Ref.: [1] Non-destructive evaluation of slot-die-coated lithium secondary batteryelectrodes by in-line laser caliper and IR thermography methods [J].ANALYTICALMETHODS.2014, 6(3): 674-683.[2]Effect of electrode manufacturing defects on electrochemical performance oflithium-ion batteries: Cognizance of the battery failure sources[J].Journal of Power Sources.2016, 312: 70-79.

